2020 wildfires on the West Coast
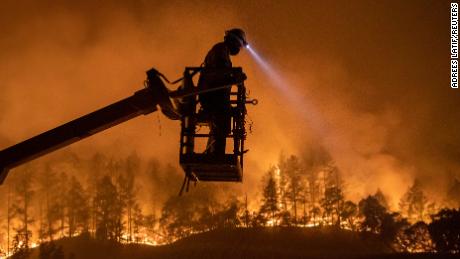
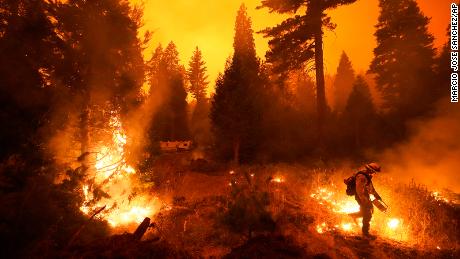
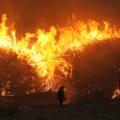
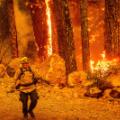
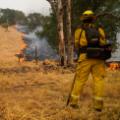
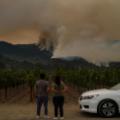
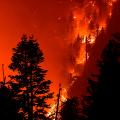
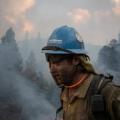
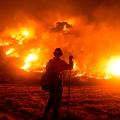
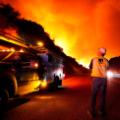
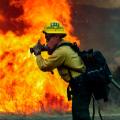
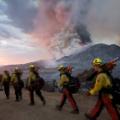
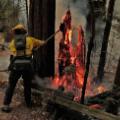
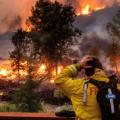
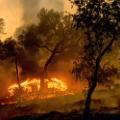
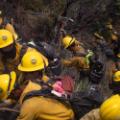
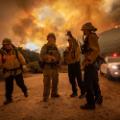
Firefighters look out over a burning hillside as they fight the Blue Ridge Fire in Yorba Linda, California, on Monday, October 26, 2020.
2020 wildfires on the West Coast
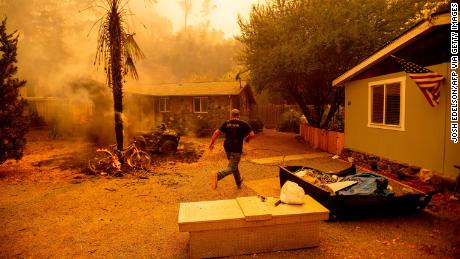
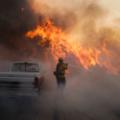
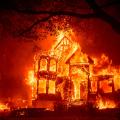
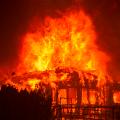
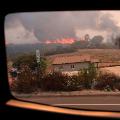
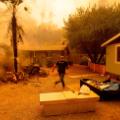
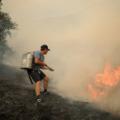
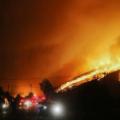
A man evacuates his home as flames from the Blue Ridge Fire approach in Chino Hills, California, on Tuesday, October 27, 2020.
2020 wildfires on the West Coast
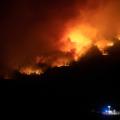
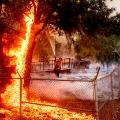
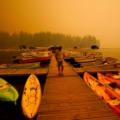
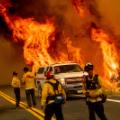
Firefighters conduct a backfire operation in Chino Hills on October 27, 2020.
2020 wildfires on the West Coast
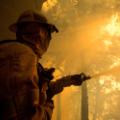
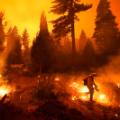
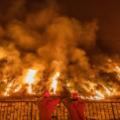
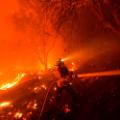
A firefighter uses a hose as the Silverado Fire approaches near Irvine, California.
2020 wildfires on the West Coast
Firefighter Raymond Vasquez battles the Silverado Fire in Irvine on Monday, October 26, 2020.
2020 wildfires on the West Coast
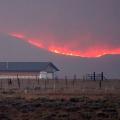
Flames rise from mountain ridges near a farmstead as a wildfire burns near Granby, Colorado, on Thursday, October 22, 2020.
2020 wildfires on the West Coast
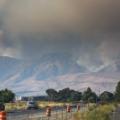
Evacuees drive through a traffic jam exiting Big Thompson Canyon as the East Troublesome Fire forced residents out of Estes Park, Colorado, on October 22, 2020.
2020 wildfires on the West Coast
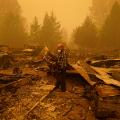
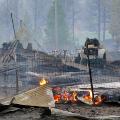
Structures burned by the Cal-Wood Fire are seen in Boulder County, Colorado, on October 18, 2020.
2020 wildfires on the West Coast
Flames from the Cameron Peak Fire, the largest wildfire in Colorado history, work their way along a ridge outside Estes Park on October 16, 2020.
2020 wildfires on the West Coast
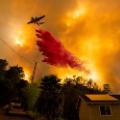
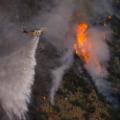
An airplane drops fire retardant on the Bruder Fire in Redlands, California, on October 15, 2020.
2020 wildfires on the West Coast
2020 wildfires on the West Coast
2020 wildfires on the West Coast
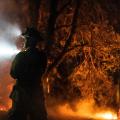
A firefighter walks along a path as the Glass Fire burns in Calistoga, California, on October 1, 2020.
2020 wildfires on the West Coast
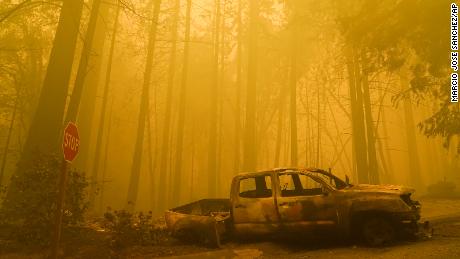
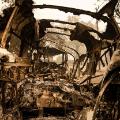
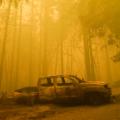
Vehicles burned in the Glass Fire sit outside of a home that survived in Calistoga on September 30, 2020.
2020 wildfires on the West Coast
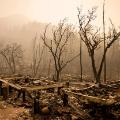
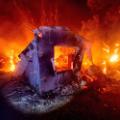
The remains of guest houses smolder at Calistoga Ranch after the Glass Fire passed through on September 30, 2020.
2020 wildfires on the West Coast
Firefighter Abraham Garcia signals a water truck in Angwin, California, on September 29, 2020.
2020 wildfires on the West Coast
Firefighters watch the Glass Fire slowly creep across a clearing near Calistoga on September 29, 2020.
2020 wildfires on the West Coast
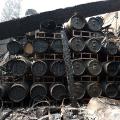
Damaged wine barrels sit stacked at the Fairwinds Estate Winery in Calistoga on September 29, 2020.
2020 wildfires on the West Coast
The Glass Fire burns in the background as Josh Asbury, an employee of CableCom, installs fiber-optic cable in Calistoga on September 28, 2020.
2020 wildfires on the West Coast
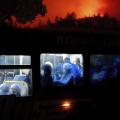
Residents of the Oakmont Gardens senior home are transported to safety as the Shady Fire approaches in Santa Rosa on September 28, 2020.
2020 wildfires on the West Coast
Cellar worker Jose Juan Perez extinguishes hotspots at Castello di Amorosa, a Calistoga winery that was damaged in the 2020 Glass Fire.
2020 wildfires on the West Coast
An officer with Napa County Animal Control rescues a cat after the Glass Fire passed through Napa Valley, California, on September 28, 2020.
2020 wildfires on the West Coast
The Glass Fire burns on a Napa County mountainside on September 28, 2020.
2020 wildfires on the West Coast
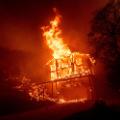
Flames from the Glass Fire consume the Black Rock Inn in St. Helena, California, on September 27, 2020.
2020 wildfires on the West Coast
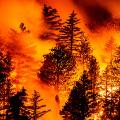
Embers fly from a tree as the Glass Fire burns in St. Helena on September 27, 2020.
2020 wildfires on the West Coast
An air tanker drops fire retardant on the Glass Fire, which was burning near the Davis Estates winery in Calistoga on September 27, 2020.
2020 wildfires on the West Coast
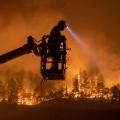
Cal Fire Capt. Jesse Campbell works to save the Louis Stralla Water Treatment Plant as the Glass Fire burns in St. Helena.
2020 wildfires on the West Coast
A photograph of Charles Morton, a firefighter killed battling the El Dorado Fire, is displayed at a memorial service in San Bernardino, California, on September 25, 2020. Morton, 39, was a 14-year veteran of the US Forest Service and a squad boss with the Big Bear Hotshot Crew of the San Bernardino National Forest.
2020 wildfires on the West Coast
An inmate firefighter takes a break while working to contain the Bear Fire in Oroville, California, on September 24, 2020.
2020 wildfires on the West Coast
Inmate firefighters extinguish hot spots while working to contain the Bear Fire on September 24, 2020.
2020 wildfires on the West Coast
The Bobcat Fire burns near Cedar Springs, California, on September 21, 2020.
2020 wildfires on the West Coast
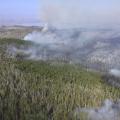
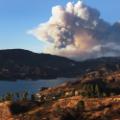
Wildfire smoke rises in Medicine Bow National Forest in southeastern Wyoming on September 21, 2020.
2020 wildfires on the West Coast
A deer looks for food in an area burned by the Bobcat Fire in Pearblossom, California, on September 20, 2020.
2020 wildfires on the West Coast
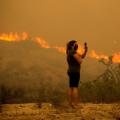
A woman takes photos as the Bobcat Fire burns in Juniper Hills, California, on September 18, 2020.
2020 wildfires on the West Coast
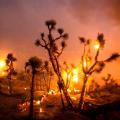
Wind whips embers from Joshua trees burned by the Bobcat Fire in Juniper Hills on September 18, 2020.
2020 wildfires on the West Coast
Firefighter Kirk McDusky walks past smoke rising from the Brattain Fire in Paisley, Oregon, on September 18, 2020.
2020 wildfires on the West Coast
A Juniper Hills home burns during the Bobcat Fire on September 18, 2020.
2020 wildfires on the West Coast
A firefighter battles the Bobcat Fire while defending the Mount Wilson observatory in Los Angeles on September 17, 2020.
2020 wildfires on the West Coast
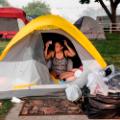
Stacey Kahny fixes her hair inside her tent at the evacuation center at the Jackson County Fairgrounds in Central Point, Oregon, on September 16, 2020. Kahny lived with her parents at a trailer park in Phoenix, Oregon, that was destroyed by fire.
2020 wildfires on the West Coast
A charred yearbook lies in the debris as Fred Skaff and his son Thomas clean up their home in Phoenix, Oregon, on September 16, 2020.
2020 wildfires on the West Coast
In this aerial photo taken with a drone, red fire retardant sits on leveled homes in Talent, Oregon, on September 15, 2020.
2020 wildfires on the West Coast
A firefighter works at the scene of the Bobcat Fire burning on hillsides near Monrovia, California, on September 15, 2020.
2020 wildfires on the West Coast
President Donald Trump listens as California Gov. Gavin Newsom speaks about the wildfires during a briefing on September 14, 2020.
2020 wildfires on the West Coast
George Coble walks through his destroyed property in Mill City, Oregon, on September 12, 2020.
2020 wildfires on the West Coast
The Bobcat Fire burns in Angeles National Forest, north of Monrovia, California, on September 11, 2020.
2020 wildfires on the West Coast
Crystal Sparks kisses her 4-year-old twins, Chance and Ryder Sutton, as they escape the Obenchain Fire in Butte Falls, Oregon, on September 11, 2020.
2020 wildfires on the West Coast
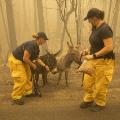
North Valley Disaster Group member Kari Zeitler and Butte County Animal Control officer Linda Newman bridle up two donkeys wandering along a roadside in Berry Creek, California, on September 11, 2020. The donkeys were displaced by the Bear Fire.
2020 wildfires on the West Coast
A firefighter shoots an incendiary device during a back burn to help control the Dolan Fire in Big Sur, California, on September 11, 2020.
2020 wildfires on the West Coast
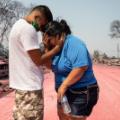
Dora Negrete is consoled by her son Hector Rocha after seeing their destroyed mobile home in Talent, Oregon, on September 10, 2020.
2020 wildfires on the West Coast
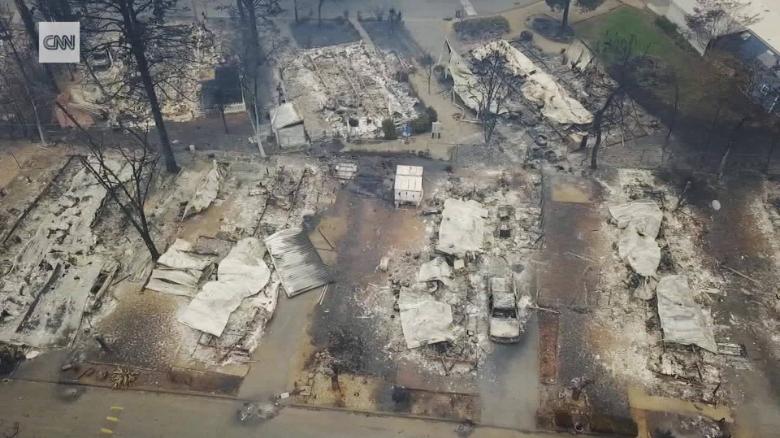
This aerial photo shows a destroyed mobile-home park in Phoenix, Oregon, on September 10, 2020.
2020 wildfires on the West Coast
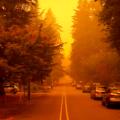
A street is shrouded by smoke from wildfires in West Linn, Oregon, on September 10, 2020.
2020 wildfires on the West Coast
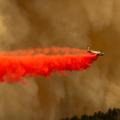
A tanker jet drops fire retardant to slow the Bobcat Fire in the Angeles National Forest north of Monrovia, California, on September 10, 2020.
2020 wildfires on the West Coast
Looking up San Francisco's Columbus Avenue, the Transamerica Pyramid and Salesforce Tower are covered with smoke from nearby wildfires on September 9, 2020. This photo was taken in the late morning.
2020 wildfires on the West Coast
2020 wildfires on the West Coast
Wildfire smoke hangs over the San Francisco-Oakland Bay Bridge on September 9, 2020.
2020 wildfires on the West Coast
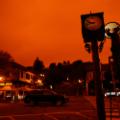
Bejhan Razi, a senior building inspector in Mill Valley, California, checks out repairs on a lamp-post clock as the sky is illuminated by nearby wildfires.
2020 wildfires on the West Coast
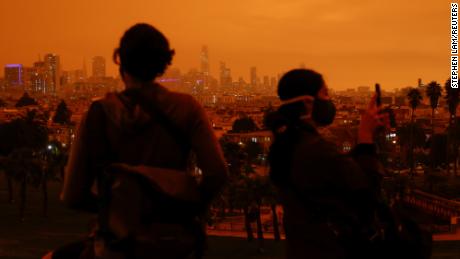
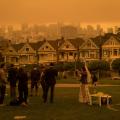
People stand in Alamo Square Park as smoke hangs over San Francisco on September 9, 2020.
2020 wildfires on the West Coast
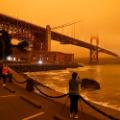
People stop to take pictures of the Golden Gate Bridge as it is affected from smoke by nearby wildfires on September 9, 2020.
2020 wildfires on the West Coast
Firefighters cut defensive lines and light backfires to protect structures in Butte County, California, on September 9, 2020.
2020 wildfires on the West Coast
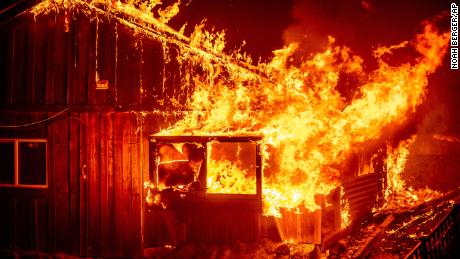
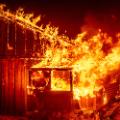
Flames shoot from a home in Butte County.
2020 wildfires on the West Coast
A Pacific Gas and Electric worker looks up at the advancing Creek Fire near Alder Springs, California, on September 8, 2020.
2020 wildfires on the West Coast
Lisa Theis unloads the last of her 44 alpacas after she evacuated her ranch in North Fork, California.
2020 wildfires on the West Coast
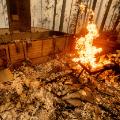
Flames burn at a home leveled by the Creek Fire in Fresno County, California.
2020 wildfires on the West Coast
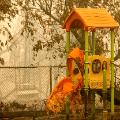
A slide is melted at a school playground in Fresno County.
2020 wildfires on the West Coast
2020 wildfires on the West Coast
Firefighter Nick Grinstead battles the Creek Fire in Shaver Lake, California, on September 7, 2020.
2020 wildfires on the West Coast
A firefighter in Jamul, California, battles the Valley Fire on September 6, 2020.
2020 wildfires on the West Coast
A fire encroaches Japatul Road in Jamul on September 6, 2020.
2020 wildfires on the West Coast
Little League baseball players warm up for a game near Dehesa, California, as the Valley Fire burns on September 6, 2020.
2020 wildfires on the West Coast
A firefighter watches the advancing Creek Fire in Shaver Lake.
2020 wildfires on the West Coast
A business owner in Shaver Lake walks next to kayaks he rents as smoke from the Creek Fire fills the sky on September 6, 2020.
2020 wildfires on the West Coast
Family members comfort each other as the El Dorado Fire moves closer to their home in Yucaipa, California, on September 6, 2020.
2020 wildfires on the West Coast
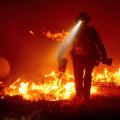
A firefighter sets a controlled burn with a drip torch while fighting the Creek Fire in Shaver Lake.
2020 wildfires on the West Coast
Dozens of evacuees are airlifted to safety on a California National Guard helicopter on September 5, 2020. The Creek Fire had left them stranded in a popular camping area in the Sierra National Forest.
2020 wildfires on the West Coast
Firefighters walk in a line in Yucaipa on September 5, 2020.
2020 wildfires on the West Coast
Haze and smoke blanket the sky near Naches, Washington, as the Evans Canyon Fire burns on September 3, 2020.
2020 wildfires on the West Coast
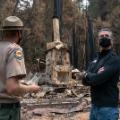
California Gov. Gavin Newsom, right, listens as Santa Cruz State Park Superintendent Chris Spohrer talks about the fire damage to the Big Basin Redwoods State Park on September 1, 2020.
2020 wildfires on the West Coast
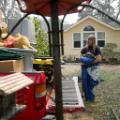
Randy Hunt packs up his belongings, including his daughter Natasha's first Pooh bear, left, in case he and his wife Sheli had to evacuate the home they rent in Middletown, California, on August 26, 2020.
2020 wildfires on the West Coast
Firefighter Juan Chavarin pulls down a burning tree trunk in Guerneville, California, on August 25, 2020.
2020 wildfires on the West Coast
A sign reading "Vaca Strong" adorns a charred hillside in Vacaville, California, on August 24, 2020.
2020 wildfires on the West Coast
Austin Giannuzzi cries while embracing relatives at the burned remains of their Vacaville home on August 23, 2020.
2020 wildfires on the West Coast
A firefighter looks out from a helicopter while battling the LNU Lightning Complex fires in Lake County, California, on August 23, 2020.
2020 wildfires on the West Coast
Flames from the LNU Lightning Complex fires leap above Butts Canyon Road in Lake County on August 23, 2020.
2020 wildfires on the West Coast
Karol Markowski of the South Pasadena Fire Department hoses down hot spots while battling the CZU Lightning Complex fires in Boulder Creek, California, on August 22, 2020.
2020 wildfires on the West Coast
A burned-out vehicle is left in front of a destroyed residence as smoke fills the sky in Boulder Creek on August 22, 2020.
2020 wildfires on the West Coast
Smoke hangs low in the air at the Big Basin Redwoods State Park as some redwoods burn in Boulder Creek on August 22, 2020.
2020 wildfires on the West Coast
A firefighter watches the LNU Lightning Complex fires spread through the Berryessa Estates neighborhood in Napa County on August 21, 2020.
2020 wildfires on the West Coast
Veterinary technician Brianna Jeter comforts a llama injured by a fire in Vacaville on August 21, 2020. At right, animal control officer Dae Kim prepares to euthanize the llama.
2020 wildfires on the West Coast
Smoke from nearby wildfires hangs over San Francisco on August 21, 2020.
2020 wildfires on the West Coast
A firefighter monitors the advance of a fire in Boulder Creek on August 21, 2020.
2020 wildfires on the West Coast
Members of the US Forest Service discuss their next moves to battle the Grizzly Creek Fire near Dotsero, Colorado, on August 21, 2020.
2020 wildfires on the West Coast
People pack brown-bag lunches at an evacuation center in Santa Cruz, California, on August 21, 2020.
2020 wildfires on the West Coast
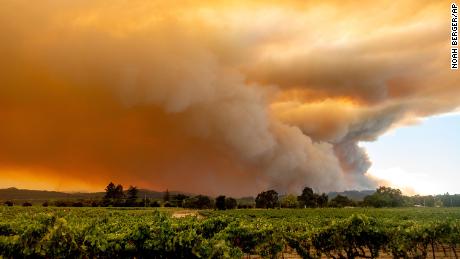
A smoke plume from the LNU Lightning Complex fires billows over Healdsburg, California, on August 20, 2020.
2020 wildfires on the West Coast
A firefighter battles flames in Santa Cruz County, California, on August 20, 2020.
2020 wildfires on the West Coast
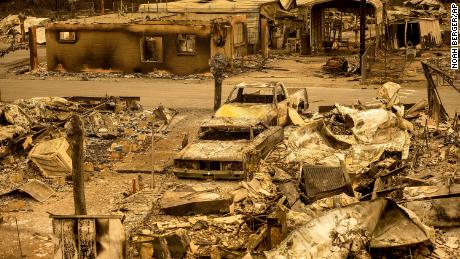
Only scorched homes and vehicles remain in the Spanish Flat Mobile Villa in Napa County, California, on August 20, 2020.
2020 wildfires on the West Coast
Peter Koleckar reacts after seeing multiple homes burned in his neighborhood in Bonny Doon, California, on August 20, 2020.
2020 wildfires on the West Coast
A forest burns in Bonny Doon on August 20, 2020.
2020 wildfires on the West Coast
A man looks at a tree blocking his way after a fire ravaged Vacaville, California, on August 20, 2020.
2020 wildfires on the West Coast
A melted plastic fence lies on the charred ground after fire swept through Vacaville on August 20, 2020.
2020 wildfires on the West Coast
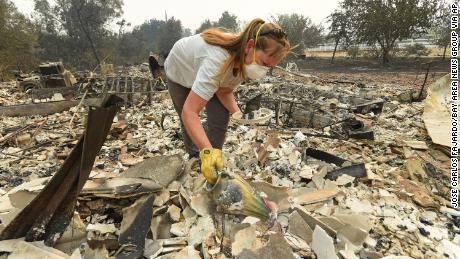
Sarah Hawkins searches through rubble after her Vacaville home was destroyed on August 20, 2020.
2020 wildfires on the West Coast
Fire crews maintain a backburn to control the River Fire near the Las Palmas neighborhood in Salinas, California, on August 19, 2020.
2020 wildfires on the West Coast
Gina Santos cries in her car after evacuating Vacaville on August 19, 2020.
2020 wildfires on the West Coast
People herd cows down Pleasants Valley Road in Vacaville on August 19, 2020.
2020 wildfires on the West Coast
Flames consume a home in Napa County, California, on August 19, 2020.
2020 wildfires on the West Coast
Embers burn along a hillside above Lake Berryessa as the LNU Lightning Complex fires tear through Napa County on August 18, 2020. This image was taken with a long exposure.
2020 wildfires on the West Coast
A resident runs into a home to save a dog while flames from the Hennessy Fire close in near Lake Berryessa on August 18, 2020.
2020 wildfires on the West Coast
A home burns as the LNU Lightning Complex fires tear through the Spanish Flat community in Napa County on August 18, 2020.
2020 wildfires on the West Coast
An air tanker drops retardant on fires in the Spanish Flat community of Napa County on August 18, 2020.
2020 wildfires on the West Coast
Flames from the Hennessy Fire consume a cabin at the Nichelini Family Winery in Napa County on August 18, 2020.
2020 wildfires on the West Coast
Tony Leonardini works on a spot fire as thunderstorm winds fan the Hennessy Fire in Napa County on August 17, 2020.
2020 wildfires on the West Coast
Smoke from the Grizzly Creek Fire is thick in Glenwood Canyon, near Glenwood Springs, Colorado, on August 16, 2020.
2020 wildfires on the West Coast
Kathy Mathison looks at the still-smoldering wildfire on August 16, 2020, that, just a day before, came within several feet of her home in Bend, Oregon.
2020 wildfires on the West Coast
Firefighters look at smoke and flames rising from the Ranch2 Fire in the San Gabriel Mountains, east of Los Angeles, on August 14, 2020.
2020 wildfires on the West Coast
A helicopter makes a water drop over the Ranch2 Fire in Azusa, California, on August 13, 2020.
2020 wildfires on the West Coast
A car is charred by the Lake Fire near Lake Hughes, 60 miles north of Los Angeles, on August 13, 2020.
2020 wildfires on the West Coast
A couple watches the Ranch2 Fire from a distance on August 13, 2020.
2020 wildfires on the West Coast
A firefighter crew works in Lake Hughes on August 13, 2020.
2020 wildfires on the West Coast
The Lake Fire burns a home in Angeles National Forest on August 13, 2020.
2020 wildfires on the West Coast
Flames and smoke from the Lake Fire rise on Wednesday, August 12, 2020.
2020 wildfires on the West Coast
A firefighter works against the Lake Fire on August 12, 2020.
2020 wildfires on the West Coast
Firefighters make an escape plan as the Lake Fire burns a hillside on August 12, 2020.
2020 wildfires on the West Coast
A tanker makes a drop on the Lake Fire on August 12, 2020.
2020 wildfires on the West Coast
A plume of smoke rises from the Lake Fire on August 12, 2020.
2020 wildfires on the West Coast
Fire crews battle the Grizzly Creek Fire near Glenwood Springs, Colorado, on August 11, 2020.

